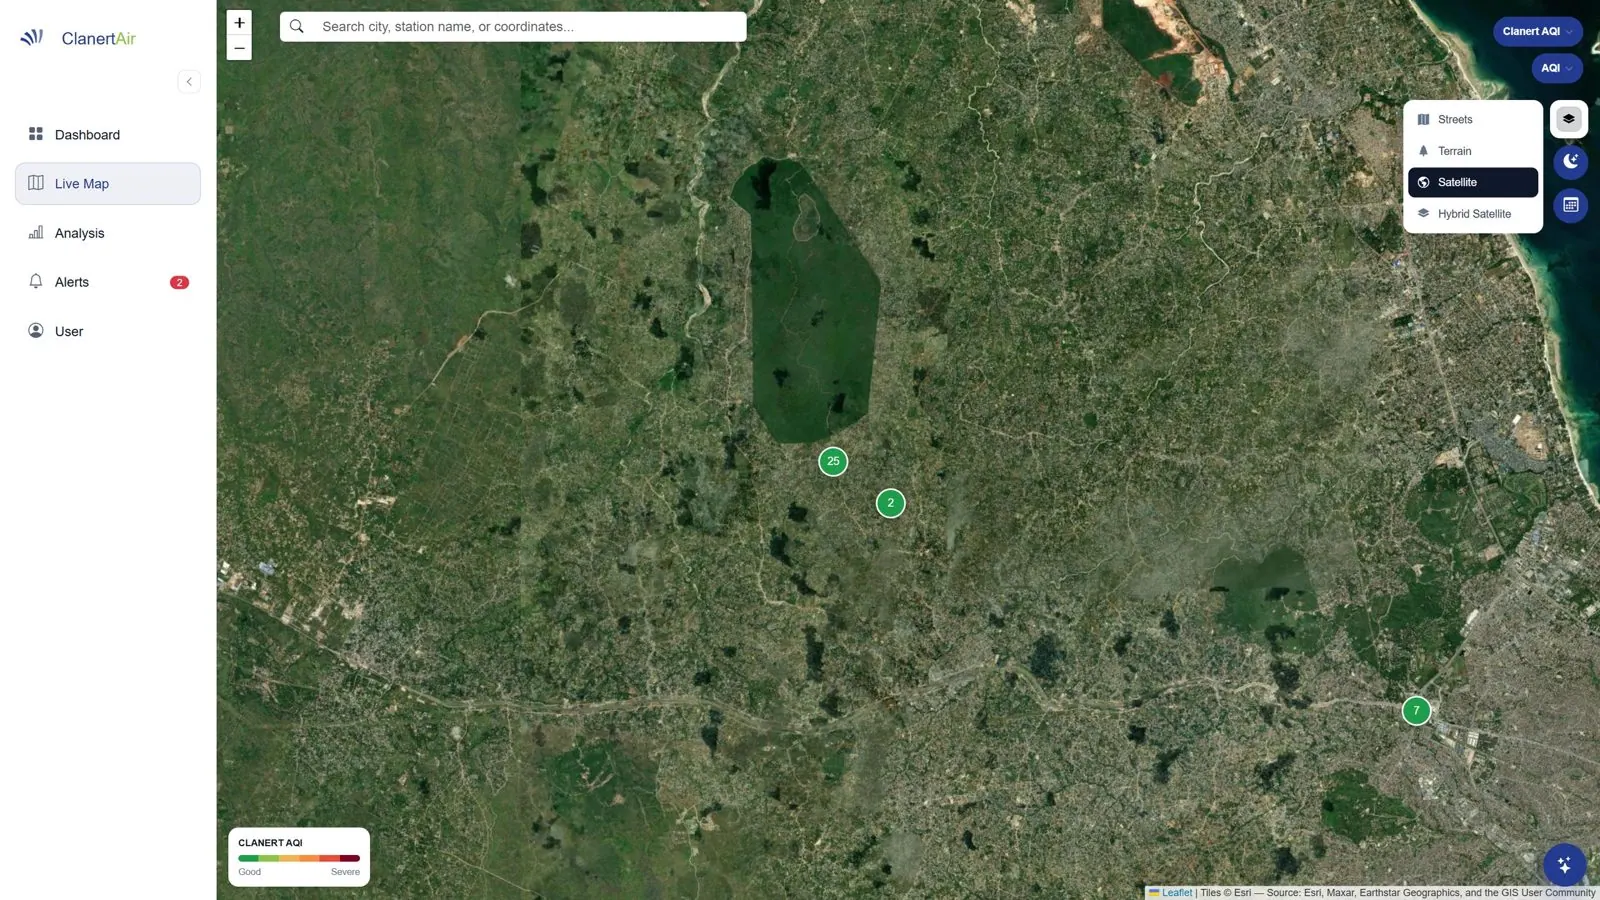
The mapping tool our engineers use every day is now open to everyone at clanertsustain.com/map. No sign-up, nothing to install.
What you can do
- Read satellite data for any place: nitrogen dioxide and sulphur dioxide from Sentinel-5P, aerosols and dust, carbon monoxide, vegetation (NDVI), land surface temperature, floods, rainfall and soil moisture. Each layer opens on its newest day.
- Compare two dates with a swipe, or play a time-lapse to show change at a quarry, a river or a city edge.
- Analyse an area: draw your site boundary and get elevation and slope from SRTM, cut and fill volumes, land cover from OpenStreetMap, today's weather and modelled air quality from Copernicus CAMS, plus statistics for the satellite layers you have on.
- Bring your own data: import KML, KMZ, GeoJSON or a zipped shapefile. It is read in your browser and never uploaded.
- Export an A4 or A3 PDF map sheet, or a PNG, with title, legend, scale bar and north arrow.
What maps cannot do
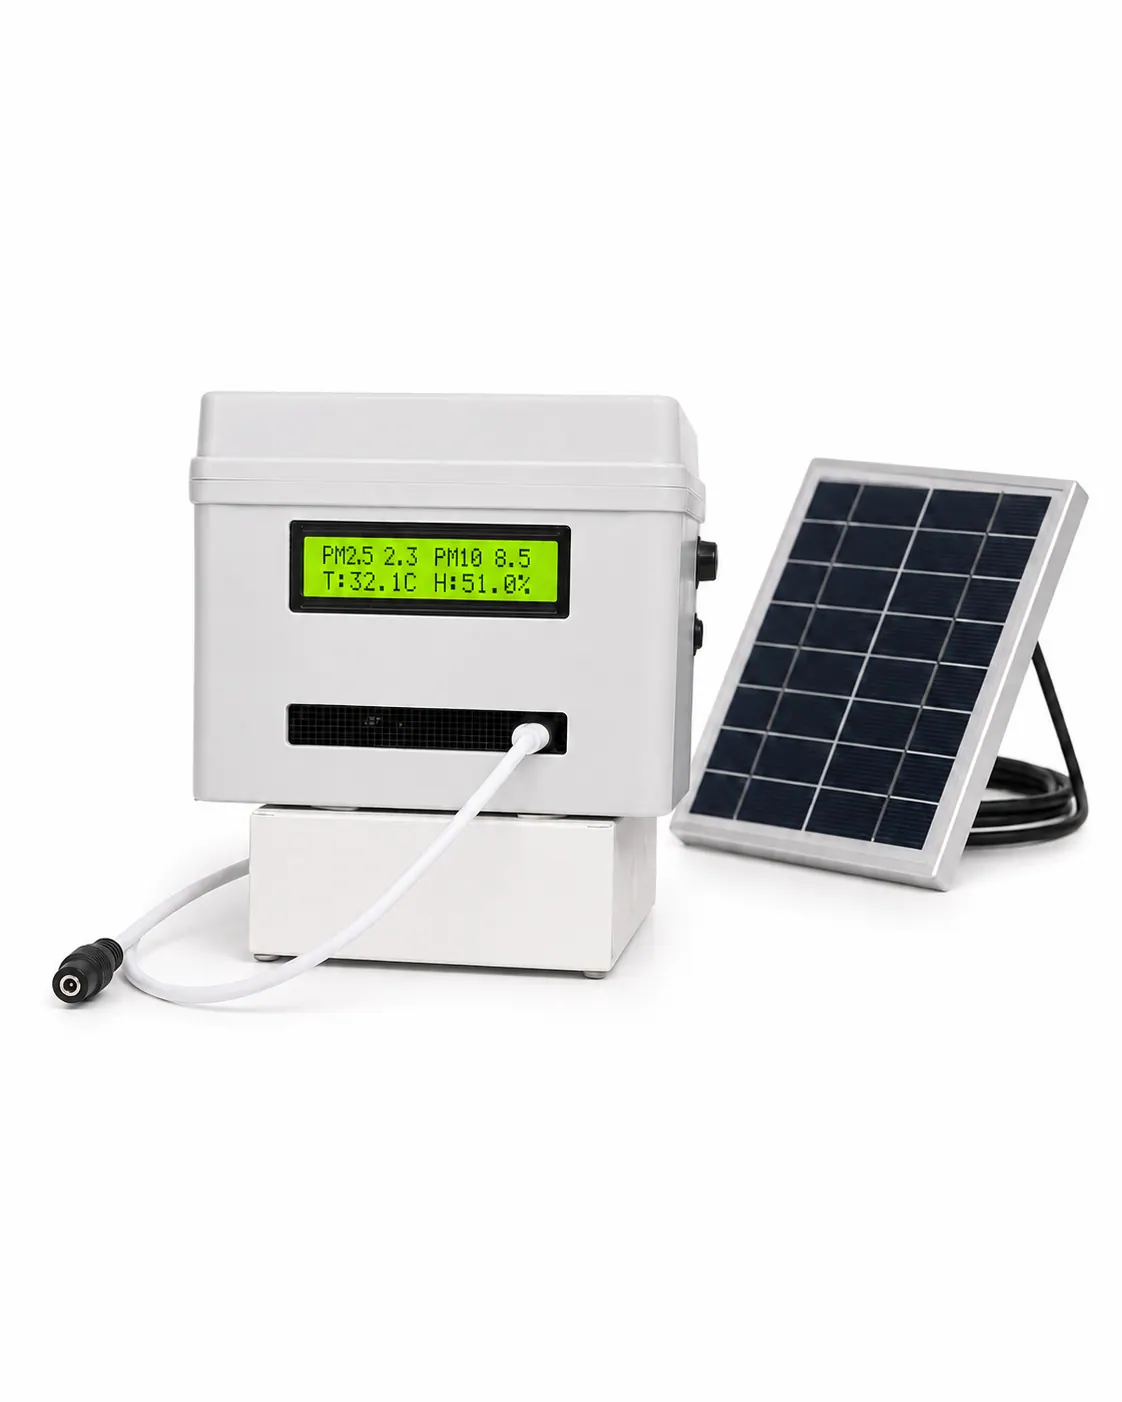
Satellite and model data describe an area of kilometres, not your fence line. To know what your neighbours actually breathe, you need a measurement at the boundary. That is what a Clanert Air pod does, every minute.